“Support and Resistance” are the main key point in Technical analysis. Analysis of Support and Resistance can be used in all kinds of Assets Markets like Stock Market, Commodities, Cryptocurrency, and Forex.
All Technical indicators are based on Support and Resistance and every Technical indicator has its own Support and Resistance levels.
Support and Resistance can be used in Intraday, long holding, Options, and Features. Hope you learned what is Support, so let’s understand here what Resistance is.
What Is Resistance?
“Resistance” is the point from which the stock or any kind of assets mentioned above started moving down. That means when a stock is rising, then at some particular level during the rising the seller gets activated at one point due to which the stock price suddenly started moving down, such a point can act as Resistance.
When finding such resistance points, means there are chances that if somehow the stock rise again then it is possible that it may go down again from the same level from where the stock price started moving down previously because sellers are available at that level which pulling stock price down, so if you are one of who already brought at Support, you should have to take the decision to exit and book the profit. The Short trader can take entry at such levels where other sellers also get activated.
How To Find Resistance?
So, if you are one who already brought at Support and wanted to know where to sell/exit, then while trading/investing you should have to first look at history, does not matter what time frame of the candle you are looking at, it applies to all time frames of the candle1 5 minutes, 10 minutes, 15 minutes,…1 Day, 1 Month.
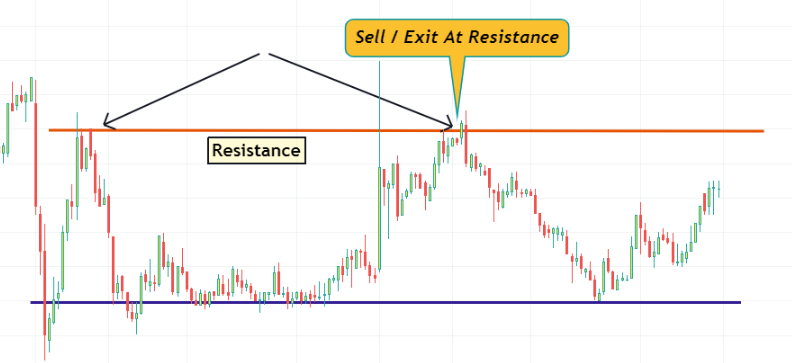
After checking history, you may find a particular level from where you see that the stock moved down; now let’s suppose at the time when you are looking at the chart, the price of a stock is still around the support level, in a such condition we should have to wait until the stock price rise and come somewhere around the same previous level from where the stock moved down, we can draw a line at that level from where the stock price was down to know the accurate price level, like below.

Exit Point
Once the stock price rise and reach close to the resistance level (red line) from where it was down, the traders who brought at support can think to exit to this level by assuming that the stock price was down from here so possible that it may fall again, so better to exit and book achieved profit.
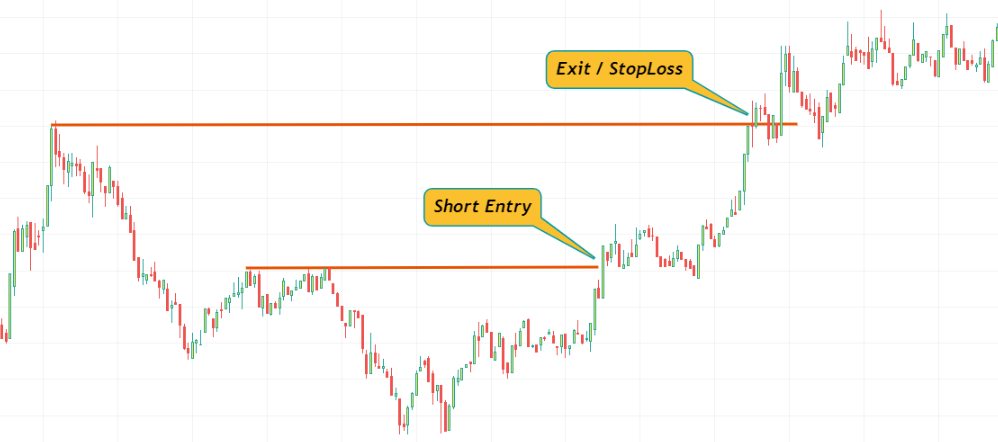
Entry Point
The entry Point at the resistance level is basically for those traders who are doing short trading means selling, they can take their short-selling entry at the resistance level.
StopLoss
StopLoss is actually for the short-seller. After taking entry at the resistance level for short sell, if the stock price moves up more or breaks the resistance level and started moving up. The stop-loss can be set to the previous resistance level. Make sure to find stop-loss points that are affordable and do not impact hugely on the entire invested capital.
You can start your Trading/Investment journey with;

Test Your Knowledge.
Go to Stock Market, you will find a Chart at the Top of the page. You can set any Time Frame, just try to find support and share your knowledge in the comment section of this post.
Conclusion
Trading indicators do not give 100% accuracy but help more to stop unnecessary loss. Support and Resistance are important keys in Technical analysis and help a lot while Trading and Investment.
Selling at the Resistance level is a good choice because it can be expected that the price may go down from the Resistance Level. However, while Trading and Investment we should trade/invest with StopLoss to avoid unnecessary losses.